April 2016:
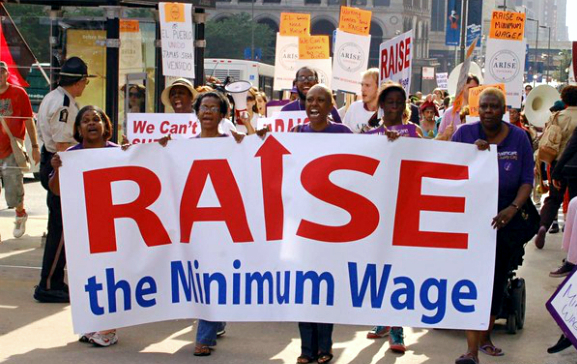
Recently politicians and activists have been sparking a national conversation over raising the federal minimum wage from its current level of $7.25 to something much higher. National unions such as SEIU have been pushing the “Fight For 15” campaign, which predictably seeks to raise the wage to $15. The issue has even made its way into the current election cycle with Democratic presidential nominee Hillary Clinton voicing support for a $12 federal minimum wage.
Some cities have already gone even further. Recently the city of Seattle recently raised its own minimum wage to $11 an hour in April of 2015 and will slowly increase to $15 an hour by 2022. The Los Angeles minimum wage will be up to $15 by 2020. San Francisco will get there by 2018.
Part of the push behind raising the minimum wage, both federally and locally, is due to the fact that the current federal minimum wage (when adjusted to 2016 dollars) is lower than it was in the 1970s. To put it another way, the increases in the federal minimum wage since the 1970s have not kept up with the rise in prices.

Adjusted for inflation, the peak minimum wage came in 1968. According to the Bureau of Labor Statistics, in 2014 roughly 3 million Americans age 16 and over earned hourly rates of pay at or below the federal minimum wage. About half of these were young workers (under the age of 25). About half were located in the South, where wages are generally lower on average. About half were in food preparation and serving.
What are the plusses and minuses of raising the minimum wage? Let’s take a look at a chart (from the 2nd edition of Economics:The Basics).

On the surface, an increase in the minimum wage means an immediate raise for these workers. However, using the tools of economics, we can dig deeper and look at the full consequences of raising the minimum wage.
The equilibrium wage and labor demanded is established at the intersection of the labor supply and labor demand curve. If we assume that the equilibrium wage is below the current federal minimum wage of $7.25, then the minimum wage interferes with market forces by establishing a “wage floor.”
In the figure above, this means that the market wage moves from the equilibrium wage of W to W’ (the minimum wage). Since wages have increased, more people enter the labor force and the quantity of labor supplied increases from L to L’’. However, since businesses now have to pay wages higher than the equilibrium wage, the quantity of labor demanded falls from L to L’. The end result is while workers receive a raise from the minimum wage, many are cut out of the labor market due to decreased demand.
If the minimum wage were raised to, say, $15 an hour, then W’ would rise and the gap between the equilibrium labor demanded L and the actual labor demanded L’ would increase. The result again is even more workers getting left out of the labor market due to a wage being set even further higher than equilibrium.
There are two other important effects. First, raising the wages for the worst-paid workers is likely to push wages for other workers as well. For example, a restaurant that pays servers more will probably have to raise the wages for supervisors as well. So the whole bottom end of the wage distribution can shift up.
The second issue in the United States is that wage levels differ from state to state and region to region. The median hourly wage in Alabama in 2015 was $15.17. By contrast, the median hourly wage in New York was $20.00. What that means is that raising the national minimum wage is more likely to hurt Alabama’s economy than New York’s.
How many jobs are likely to be lost when the minimum wage is increased? Since there have been multiple minimum wage increases at the federal level over the past 100 years, economists can look at the results of previous wage hikes when trying to figure out what will happen in the future. Furthermore, states and municipalities have the ability to set their own minimum wages above the federal level if they so choose, providing pockets of “experimentation” for economists to dissect the effects of the minimum wage.
Indeed, this approach has been used by economists in the past. For example, a study by David Card and Alan Kruger evaluated the effects of a 1992 minimum wage hike in New Jersey by comparing fast food employment in both New Jersey and eastern Pennsylvania (which, while adjacent to New Jersey, did not increase the minimum wage). Despite economic theory predicting job losses, Card and Krueger found no indication that the minimum wage raise reduced employment.
While Card and Krueger’s research suggests that economic theory does not hold up in the real world when applied, many other studies have confirmed the theory that minimum wage hikes result in job losses. For example, a February 2014 report from the Congressional Budget Office predicted that if the minimum wage were raised to $10.10 an hour, the effect on employment could be as high as a loss of 1 million jobs. The reality is economists are divided over the “true” effects of increasing the minimum wage, and are constantly looking at new ways to confirm or reject the economic theory behind it.
Of course, the effects of raising the minimum wage aren’t just confined to the number of jobs that would potentially be lost – it can also alter the way establishments conduct business. For example, since Seattle imposed a minimum wage hike, many restaurants, now forced to pay their workers a higher wage, have done away with tips. Additionally, some customers may notice that prices for meals have risen so that businesses can afford to pay their workers more. And in some cases, businesses operating with slim margins that have a workforce of mostly minimum wage employees may be forced to shut their doors.
In the end, raising the minimum wage is the right thing to do. But there’s still not agreement about the right amount.
Note: This textbook-based blog is explicitly non-political. We analyze current events for the beginning economics students without imposing our own views on the topic.
Key Terms
Labor supply curve: Reports, for each level of wages, how many people are in the labor force, or the quantity of labor hours supplied.
Labor demand curve: Reports how many workers businesses will want to hire, or how many hours of labor they will want to pay for, given the market wage.
Review Questions
Review questions for Mandel 2e
Additional Readings
“Minimum wage: Updated research roundup on the effects of increasing pay,” Journalist Resource, July 27,2016


